What is AIOps Cockpit?
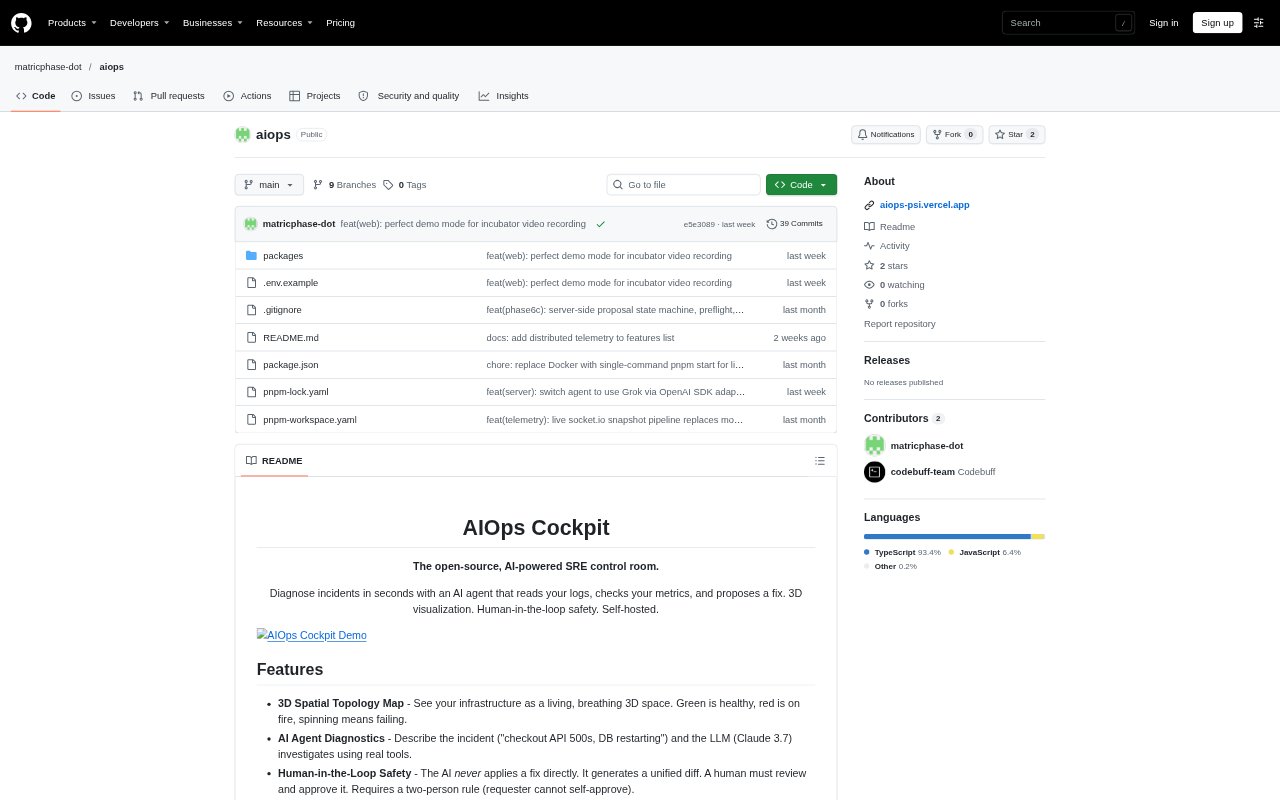
AIOps Cockpit is an open-source, self-hosted SRE control room for teams investigating infrastructure incidents. It combines a 3D view of infrastructure with live host and Docker telemetry, then lets an AI agent investigate a described problem using logs, metrics, and tools. The agent proposes a fix as a unified diff, while people retain approval authority. A central cockpit can also receive telemetry from remote servers through a lightweight agent.
AIOps Cockpit Features:
3D Spatial Map: The topology map represents infrastructure in 3D, using colors to show health and animation to indicate failing systems.
AI Agent Diagnostics: Describe an incident and the AI agent investigates it using operational tools, logs, and metrics before proposing a fix.
Human Review Gate: The agent generates a unified diff rather than applying a fix, and a separate person must approve it under a two-person rule.
Defense in Depth: Safety controls include append-only audit logs, prompt-injection defenses, a strict tool allowlist, and destructive actions disabled by default.
Live Host Telemetry: The cockpit displays real-time CPU, RAM, and disk metrics alongside Docker container states.
Distributed Telemetry: A lightweight remote agent streams Docker and host metrics securely from servers to the central cockpit.
Gesture Controls: Optional MediaPipe hand controls let users zoom, rotate the camera, and select items with gestures.
AIOps Cockpit Benefits:
Faster Orientation: A visual view of infrastructure health helps responders orient themselves and identify which systems need attention.
Broader Incident Context: Using logs and metrics together gives investigations evidence from more than the incident description alone.
Human-Controlled Changes: Separate approval keeps repair decisions with people, even when an AI agent prepares the proposed change.
Reviewable History: Append-only audit records give teams a way to examine operational activity after an incident.
Remote Visibility: Streaming telemetry from remote hosts brings distributed servers into the same monitoring view as the central system.
Use Cases:
API Error Triage: Investigate a checkout API returning 500 errors while its database is restarting by describing the symptoms for the agent to examine.
Host Health Checks: Monitor CPU, RAM, disk usage, and Docker container status while checking a host's place in the infrastructure topology.
Remote Server Monitoring: Bring AWS, GCP, or homelab servers into a central operations view by installing the telemetry agent on each server.
Patch Review: Review an AI-generated unified diff during incident response and require a second person to approve the proposed fix.
Topology Navigation: Use hand gestures to rotate or zoom the 3D infrastructure view and select items during an operational review.