

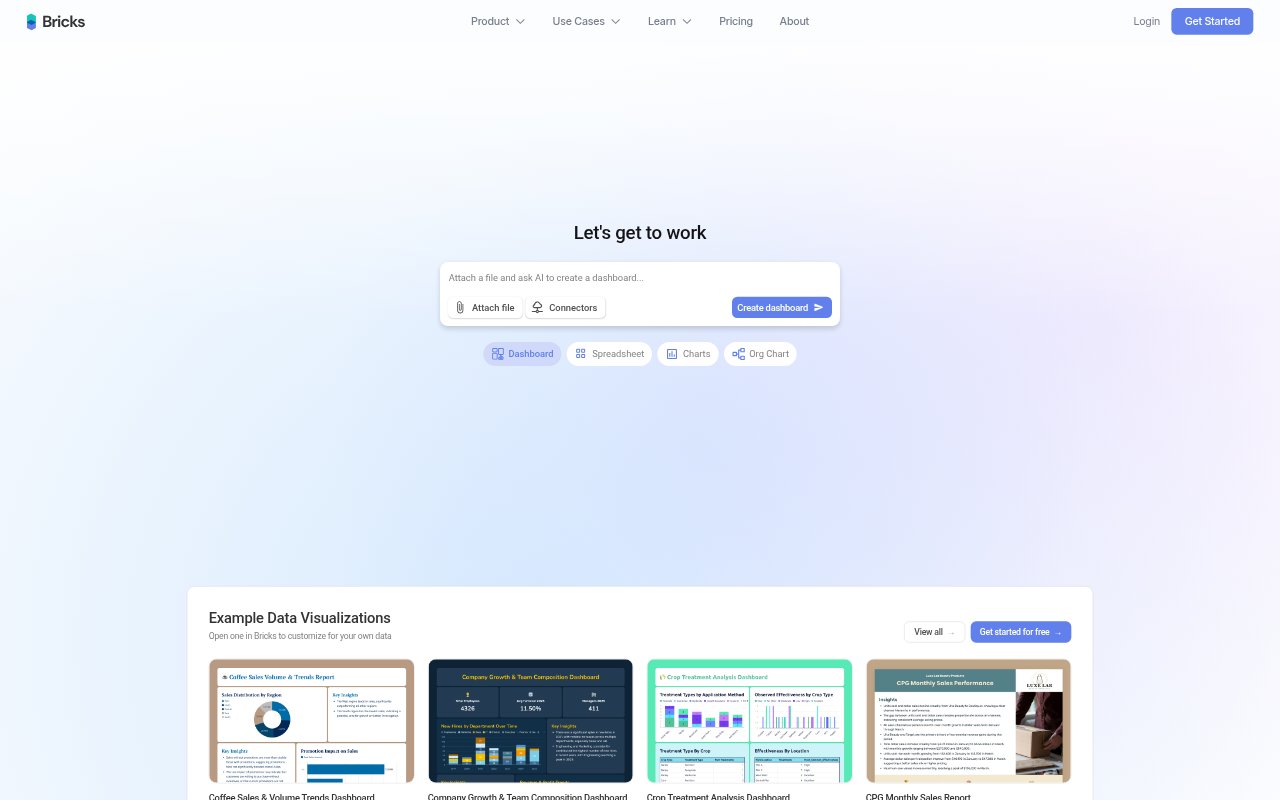
What is Bricks?
Bricks is an AI data analysis and reporting tool for people who need to turn spreadsheet or file data into dashboards, reports, and visualizations. Upload CSV, Excel, or PDF data to generate charts, tables, and insights, then adjust the results manually or with natural-language instructions. It is designed for individuals and teams who want to present data clearly without building every chart and report by hand.
Bricks Features:
AI Dashboards: Generate dashboards with charts, tables, key metrics, and insights from uploaded CSV, Excel, or PDF data.
AI Data Analysis: Ask questions about your data and use AI to analyze it, transform it, or request additional visualizations.
Dashboard Editing: Drag, drop, and customize dashboard elements manually, or use natural-language requests to edit them with AI.
Interactive Filters: Select a data point to filter the rest of a dashboard and explore related information.
Reusable Templates: Save a dashboard layout as a template and reuse it with fresh data.
Data Import and Export: Import data from Google Sheets or databases, and export to formats including PDF, PPTX, XLSX, and HTML on eligible plans.
Bricks Benefits:
Less Manual Work: Automated chart creation and dashboard refreshes reduce repetitive setup and recurring report updates.
Clearer Reporting: Polished visual themes help make results easier to present and understand without separate design work.
More Direct Control: Editing charts and data within a dashboard makes it easier to refine a report around the questions that matter.
Reusable Reporting: Saved layouts let teams repeat a reporting format with new data rather than rebuilding it each cycle.
Faster Exploration: Interactive filtering helps people investigate patterns in a dashboard without preparing separate views for each question.
Use Cases:
Monthly Performance Reports: Create a recurring staff or department report from spreadsheet exports, then refresh its charts when new data arrives.
Agency Client Dashboards: Combine Harvest, QBO, and Toggl exports to track billable utilization, project margins, and client profitability.
Student Data Reviews: Turn student spreadsheets into visual summaries for reviewing trends and sharing findings without relying on IT support.
Sales and Inventory Tracking: Build a dashboard from sales or inventory files to review activity, stock levels, and production information.
Project Cost Monitoring: Use project data to create a report that brings costs and timelines together for regular progress reviews.