
What is DataLine?
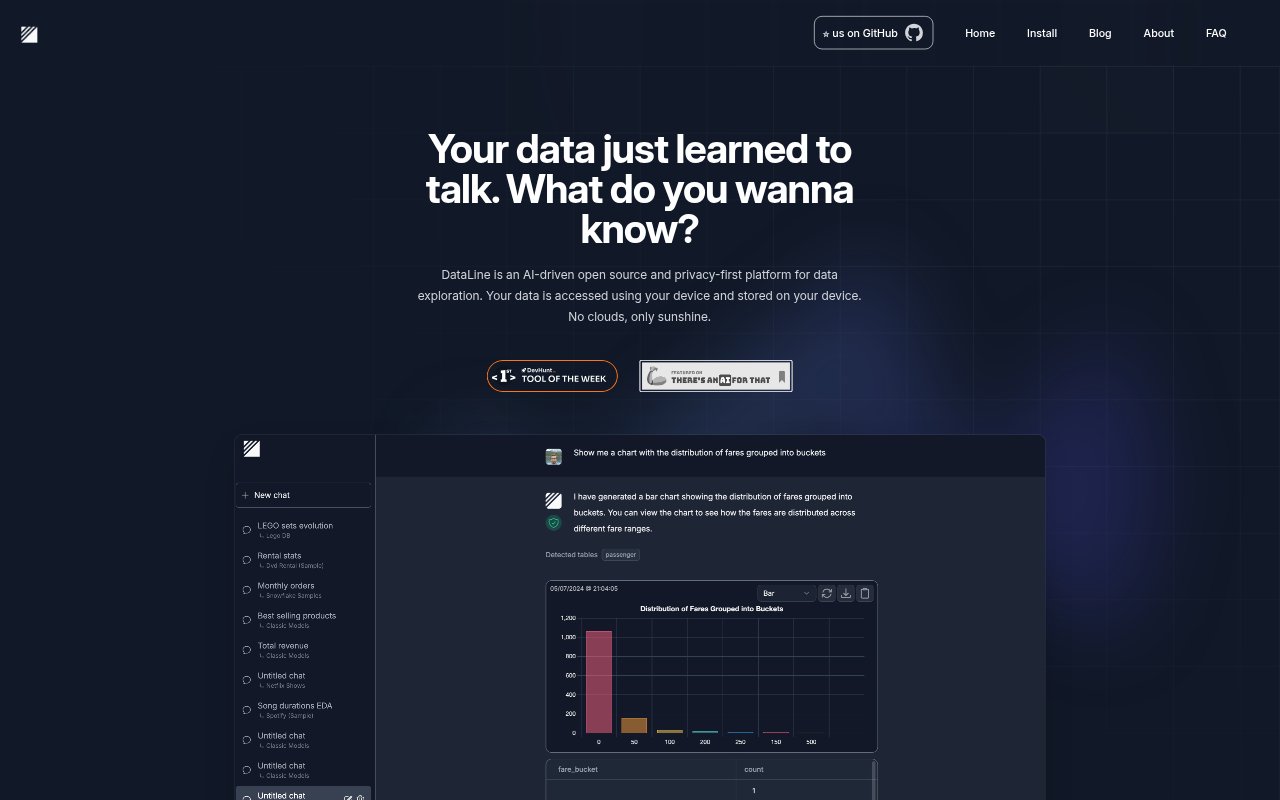
DataLine is an AI-driven data analysis and visualization tool for asking questions about data in a chat interface. It generates tables, charts, and dashboards from those interactions. The product is intended for non-technical people who want to query data, as well as developers looking for a text-to-SQL solution. It brings conversational data analysis and visual presentation together, so users can explore information and view results in formats suited to their questions.
DataLine Features:
Chat-Based Analysis: Users can interact with their data through chat, making questions the starting point for analysis.
AI Data Analysis: DataLine uses AI to support analysis of data, rather than limiting the interaction to a static display.
Table Generation: The tool generates tables from data conversations, giving users a tabular format for viewing results.
Chart Generation: Users can generate charts to view data visually alongside other forms of output.
Dashboard Generation: DataLine can generate dashboards, bringing data visualizations into a dashboard format.
Text-to-SQL: Developers can use DataLine as a text-to-SQL solution for turning conversational requests into data queries.
Nontechnical Querying: The product is designed to let non-technical users query data through a conversational interface.
DataLine Benefits:
Lower Query Barrier: People who do not work with SQL can still start exploring their data, reducing reliance on technical help for every question.
Quicker First Results: Starting with a question in chat can help users reach an initial view of their data without first building a report by hand.
More Readable Findings: Offering tables, charts, and dashboards gives users different ways to review results and choose a format that suits the question.
Developer Support: A text-to-SQL option gives developers a way to work with data requests expressed conversationally.
Use Cases:
Everyday Data Questions: A non-technical team member can ask a question about available data when they need a quick view of what it contains.
SQL Query Drafting: A developer can use conversational requests as a starting point for querying data through a text-to-SQL workflow.
Tabular Result Review: Someone checking analysis results can generate a table to inspect the information in rows and columns.
Visual Data Review: A user looking for a visual view of analysis can generate a chart rather than relying only on tabular results.
Dashboard Preparation: A person who wants data presented in dashboard form can use DataLine to generate a dashboard from their analysis.