

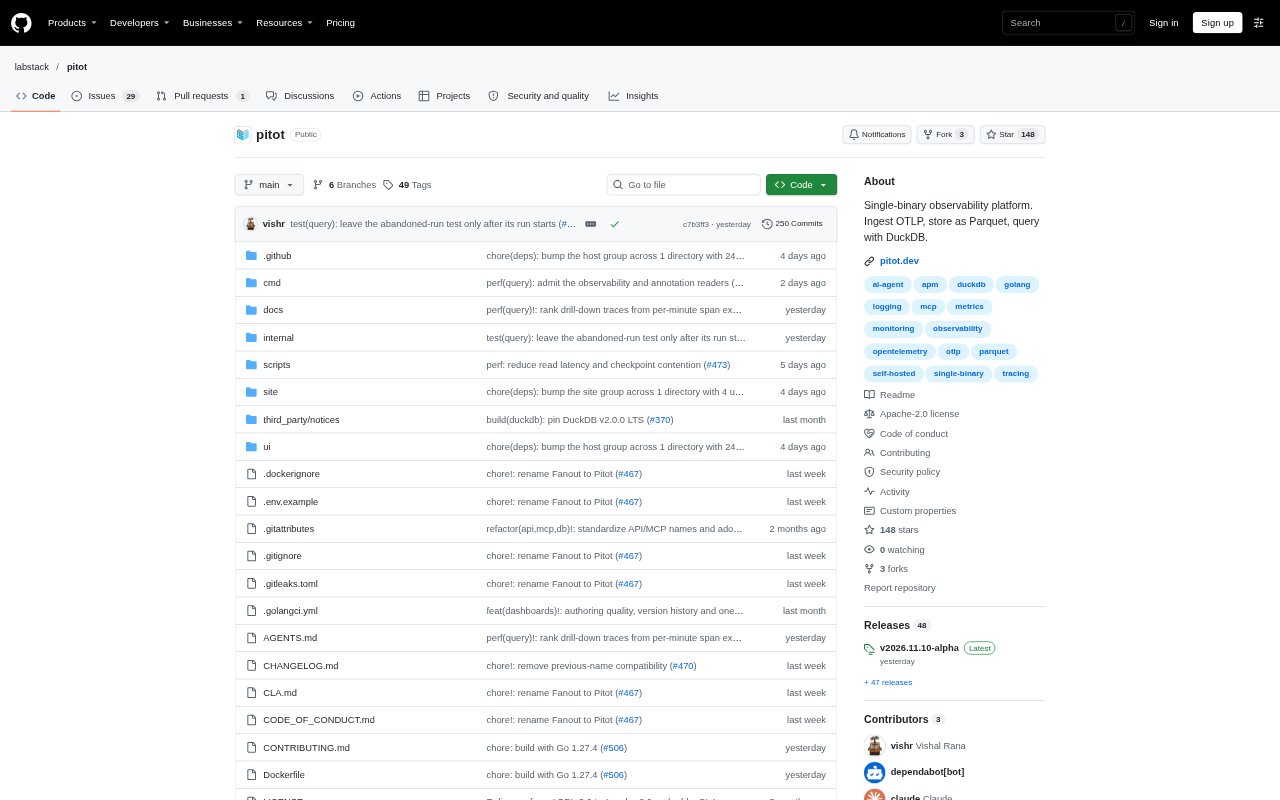
What is Fanout?
Pitot is a self-hosted observability platform that receives OpenTelemetry traces, logs, and metrics in one binary and stores them in a local data directory. Teams can explore telemetry directly, use a built-in AI agent to investigate incidents, or connect an external agent through MCP. It is designed for single-node deployments rather than clustered or horizontally scaled systems, and is currently pre-release, so capabilities may change without migration paths.
Fanout Features:
OTLP Ingest: Pitot accepts OpenTelemetry traces, logs, and metrics over OTLP using either gRPC or HTTP.
Local Storage: Telemetry is stored in Parquet files, with DuckDB for analytics and SQLite for transactional product state.
Agent Investigations: A built-in agent can query telemetry and answer plain-language questions about what the evidence shows.
MCP Tools: External agents can use typed MCP tools to query telemetry, search logs, inspect traces, preview panels, and create dashboards.
Dashboard Creation: An agent can turn a sentence into a saved dashboard with service metrics, dependency maps, slow operations, logs, and traces.
Alerts and Queries: Users can explore telemetry and use PitotQL without an AI provider, and configure alerts for service errors, latency, throughput, and log volume.
Fanout Benefits:
Fewer Services: A single process and data directory reduce the number of separate storage and query components a team must operate.
Data Stays Local: Self-hosting keeps telemetry on the machine or environment where Pitot is deployed instead of sending it to a managed service.
Faster Triage: Plain-language investigations can help teams move from a broad incident question to evidence across traces, logs, and metrics.
Shared Agent Access: A consistent set of typed query tools lets the built-in agent and external agents work with the same telemetry.
No AI Required: Telemetry exploration and PitotQL remain available when a team does not configure an AI provider.
Use Cases:
Service Latency: Ask which service is slowest during an incident, then review its latency alongside related telemetry.
Error Investigation: Investigate a rise in service errors by querying logs, traces, and metrics for evidence in one place.
Incident Dashboards: Create a dashboard for an incident that brings together request rates, error rates, latency, dependency maps, and recent errors.
Agent Workflows: Connect an MCP-compatible agent to query telemetry, inspect a trace, or save a dashboard as part of an investigation.
Small Deployments: Run observability for a single-node environment that needs OTLP ingestion without operating separate storage services.