

What is FigureLabs?
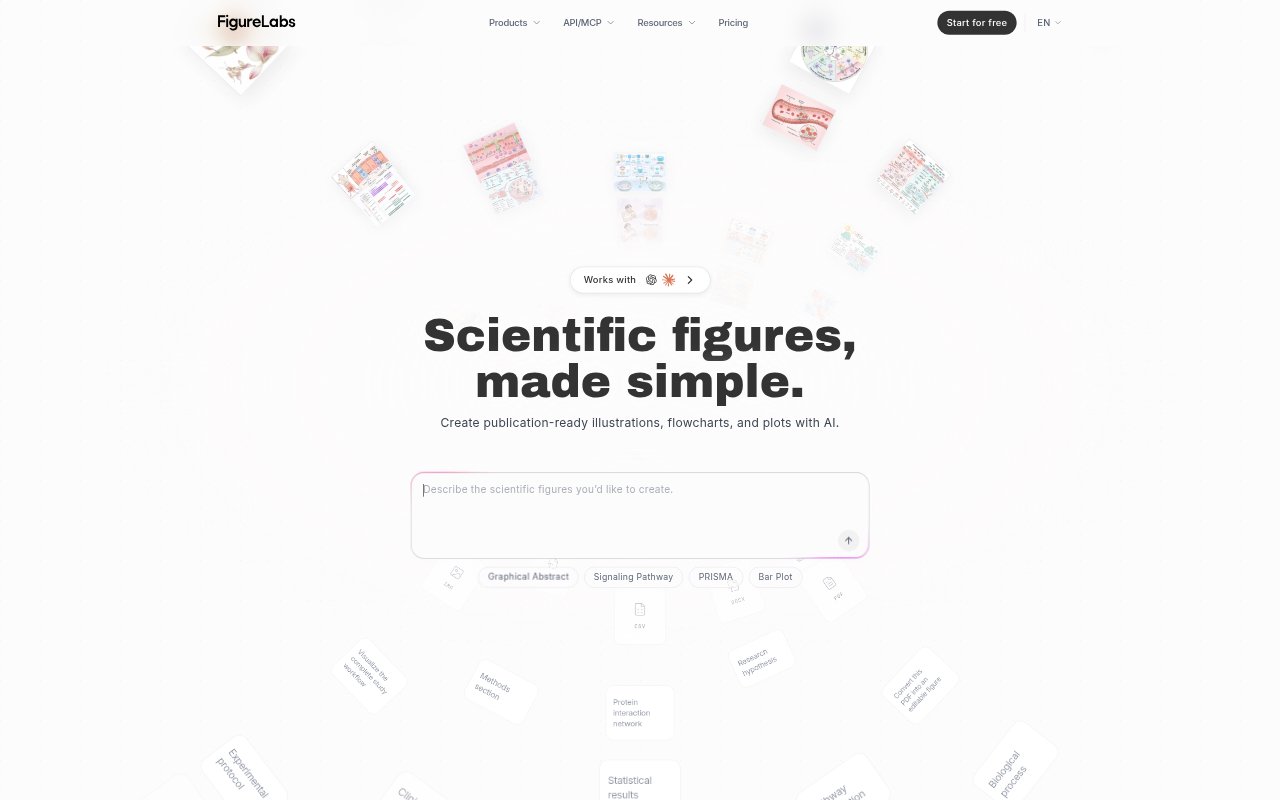
FigureLabs is an AI tool for creating scientific illustrations, flowcharts, plots, and posters. Researchers can start with text, sketches, lab photos, spreadsheets, PDFs, or reference figures, then generate and refine visuals on an editable canvas. It offers export options for publication and collaboration, and a free plan with 150 one-time credits; free-plan use is non-commercial.
FigureLabs Features:
Scientific Illustrations: Generate scientific illustrations from written descriptions or sketches and export them as editable PPTX or SVG files, or as PNG and JPG images.
Flowchart Creation: Create vector-based flowcharts with editable elements for research papers and grant proposals.
Plot Generation: Turn raw data and statistical results into plots, then refine details through AI chat.
Flexible Inputs: Upload text, sketches, lab photos, Excel files, PDFs, and reference figures as starting material.
Canvas Editing: Adjust figures on an infinite canvas using editable layers, text editing, AI redraw, background removal, and upscaling.
Shared Review: Invite collaborators to comment and make suggestions on a canvas in real time.
Publication Certificate: Download a PDF certificate with a unique ID to document publication and commercial-use rights.
FigureLabs Benefits:
Less Manual Drawing: Researchers can move from an idea or existing reference to a draft figure without building every visual element from scratch.
Easier Revisions: Editable layers and vector exports make it possible to adjust individual parts instead of recreating a finished figure.
Consistent Figures: Keeping icons, arrows, fonts, and visual style consistent helps figures across a paper look like part of the same work.
Clearer Collaboration: Real-time comments and suggestions give collaborators a shared place to review figures and communicate changes.
Rights Documentation: A downloadable certificate provides a verifiable record of rights when figures are prepared for publication or commercial use.
Use Cases:
Paper Illustrations: Create a scientific illustration from a written explanation or sketch for inclusion in a research manuscript.
Grant Proposals: Build an editable flowchart to show the stages or relationships in a proposed research project.
Data Figures: Convert raw data or statistical results into a plot and refine its details before adding it to a paper or presentation.
Graphical Abstracts: Prepare a visual summary of a study using a combination of text prompts, reference figures, and canvas edits.
Team Figure Review: Share a draft canvas with collaborators so they can comment on and suggest changes to figures before submission.