

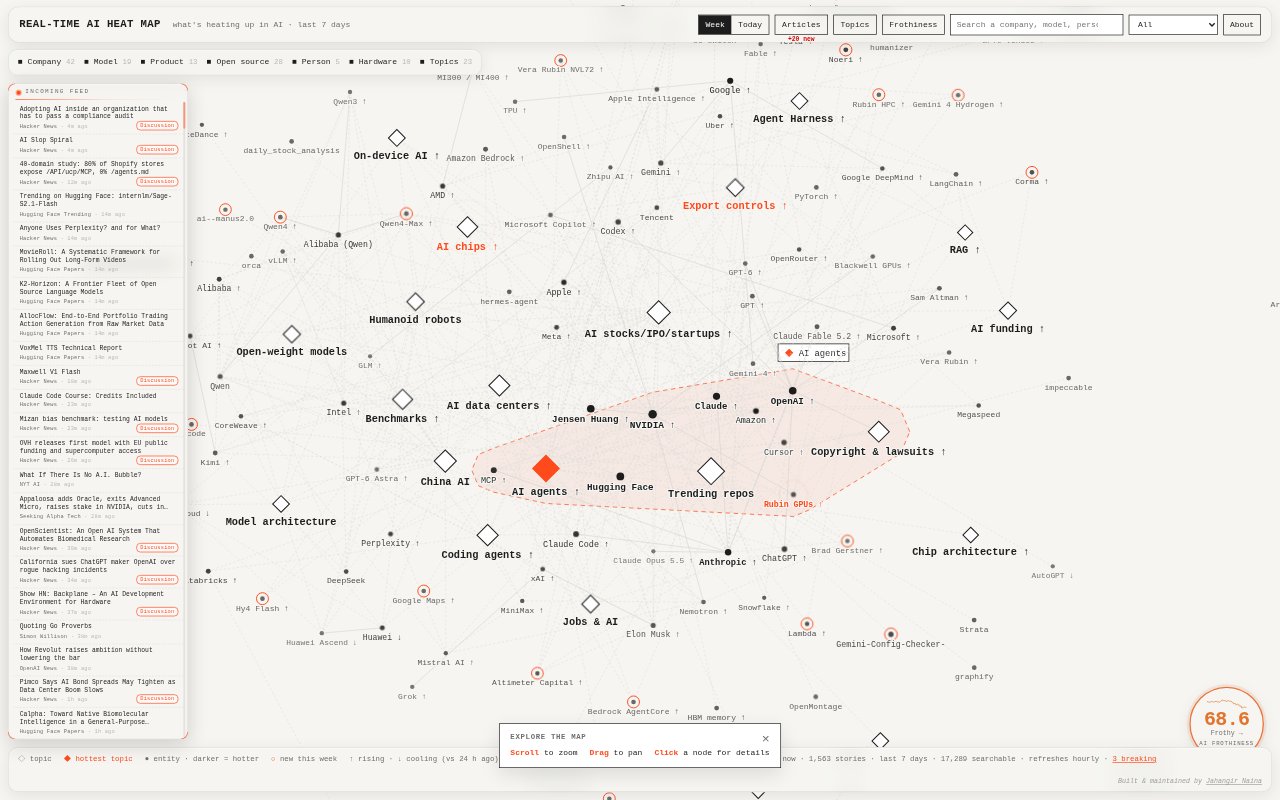
What is Jag's AI Heat Map?
Jag's AI Heat Map is an interactive view of AI companies, models, products, people, hardware, and ideas attracting attention in AI news and developer communities. It draws on more than 125 sources and updates continuously, showing entities as connected nodes whose size, position, and links indicate how much attention they receive. Users can switch between a seven-day view and a 24-hour view, then open an article archive to inspect the coverage behind the map. It is useful for people who want to follow changes across the AI landscape.
Jag's AI Heat Map Features:
Interactive Map: Zoom and pan around a map of AI entities, then select a node to view its details and place among related topics.
Two Time Views: Switch between a seven-day view with a 24-hour heat half-life and a 24-hour view with a six-hour half-life.
Attention Scoring: Stories add heat to mentioned entities, with source and popularity signals such as Hacker News points, Hugging Face upvotes, and GitHub stars affecting the score.
Entity Connections: Lines connect entities that appear in the same stories, while node size, centrality, and connectedness convey relative attention.
Trend Indicators: Labels and rings flag entities that are breaking, newly spotted, heating up, or cooling, using recent attention changes.
Article Archive: Browse a 90-day archive grouped by source, filter to an individual source, and open any headline in a new tab.
Live Updates: The map updates continuously from more than 125 sources, and an indicator shows how many new articles were found in the last hour.
Jag's AI Heat Map Benefits:
Faster Topic Scanning: A visual overview helps users spot where attention is concentrated without having to read every AI story first.
Earlier Signals: Recent-change markers make it easier to notice entities gaining attention before relying on a longer-term view.
Useful Context: Connections between entities can help users understand which companies, ideas, and products are being discussed together.
Source Checking: Access to the articles behind the map lets users investigate why an entity is prominent and assess the coverage themselves.
Flexible Monitoring: The two time windows help users distinguish a short-lived burst of coverage from attention that has persisted over several days.
Use Cases:
Market Research: Scan the AI landscape for companies, products, and topics receiving attention while researching a market or emerging category.
Editorial Planning: Look for fast-rising topics and inspect their related articles when choosing subjects for an AI newsletter or industry briefing.
Competitor Tracking: Check whether a company or product is appearing in recent AI coverage, then review the stories that mention it.
Startup Discovery: Explore the map for less familiar AI entities connected to a topic relevant to a founder's product or business.
Daily Industry Review: Use the 24-hour view to review what has changed recently, then switch to the weekly view for broader context.