

What is MacMonitor?
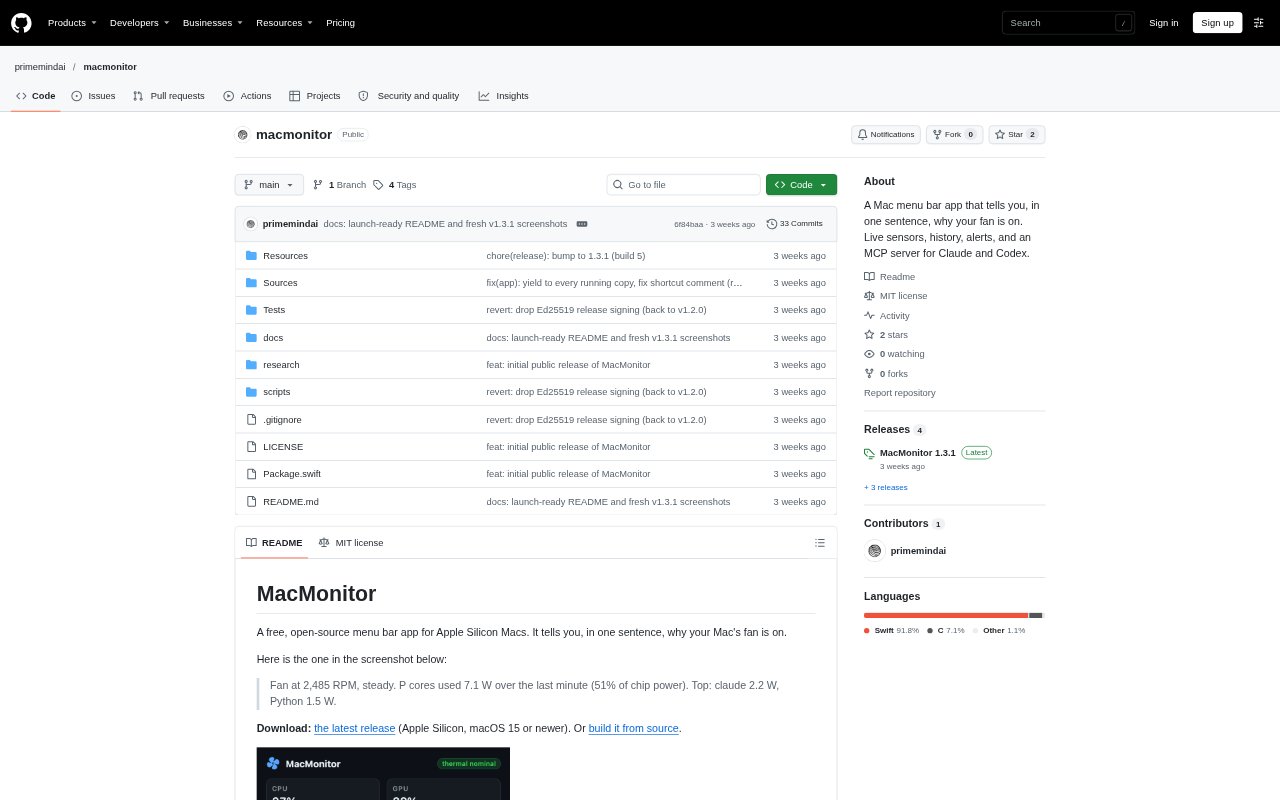
MacMonitor is a free, open-source menu bar app for Apple Silicon Macs that summarizes why the fan is running and displays live hardware readings. Its window includes graphs, history, alerts, and pages for different parts of the Mac, while an optional read-only MCP server makes the same data available to Claude, Codex, and other MCP clients. It requires macOS 15 or newer and does not control the fans or write to the system management controller.
MacMonitor Features:
Fan Summary: The menu bar popover gives a one-sentence explanation of fan activity alongside readings such as fan speed, processor power, and top energy-using apps.
Live Hardware Views: The overview and detail pages show CPU, GPU, temperature, fan, memory, power, battery, disks, network, and app activity, with live graphs and a chip map.
Metric History: Open a metric's history chart to review readings across periods of 15 minutes, one hour, 24 hours, or 30 days.
Hardware Events: The event log records signals such as fan ramps, heat, throttling, memory pressure, disk activity, battery flags, and wake events.
Alerts and Settings: Settings let you choose alert switches and thresholds, adjust the sample rate and history size, start the app at login, and clear stored history.
Read-Only MCP: An optional MCP server provides snapshots, fan explanations, process rankings, history, events, sensor details, and hardware health to Claude, Codex, or another MCP client.
MacMonitor Benefits:
Understand Fan Activity: A concise explanation with supporting readings can help narrow down which apps or processor activity may be contributing to fan noise.
Spot Changes Over Time: Metric charts and event records make it easier to review whether a temperature, fan, or other reading changed during a period of use.
Keep Hardware Control: Because MacMonitor only reads system data and does not change fan settings, you can inspect conditions without handing it control of cooling.
Avoid Admin Setup: The app does not require a privileged helper or administrator password to read its supported hardware data.
Limit Data Exposure: MacMonitor sends no information about your Mac during its update checks, and you can turn those checks off in Settings.
Use Cases:
Investigate Fan Noise: Check the fan summary and top energy-using apps when a Mac's fan starts running during coding, video work, or other demanding tasks.
Review Heat Spikes: Use temperature history and event records to inspect when a Mac ran hot or showed signs of thermal throttling.
Check App Activity: Compare CPU, memory, energy, GPU, or disk use by app when tracking down a process that appears to be consuming system resources.
Monitor Battery Health: Open the power and battery pages to review related readings and check recorded battery events.
Ask an AI Client: Connect Claude or Codex through the optional MCP server to query current hardware readings or review available history and events.