
What is mcpspan?
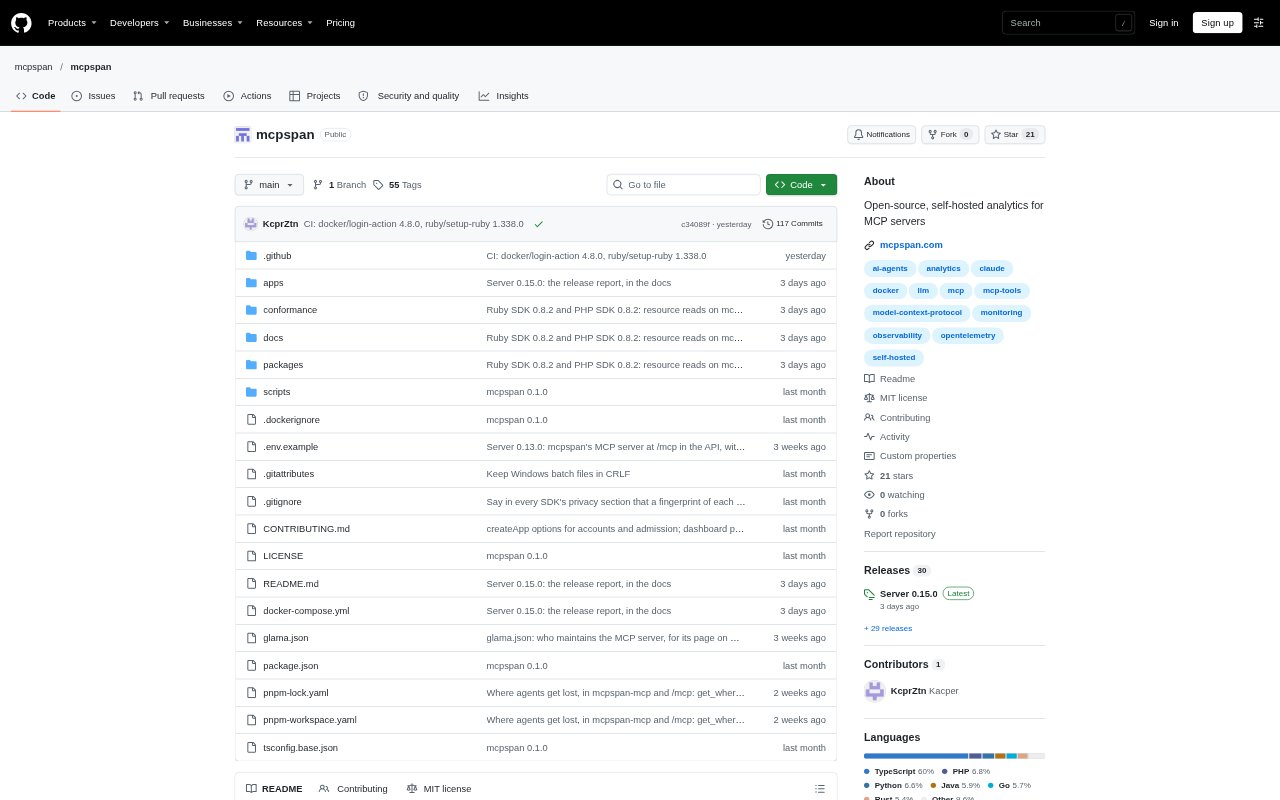
mcpspan is an analytics tool for teams building and operating Model Context Protocol (MCP) servers. It tracks how agents use tools, resources and prompts, including which clients make calls, how quickly they are answered and why they fail. Developers can add an SDK in one of eight languages or put a proxy in front of a server, then use the dashboard to investigate usage and compare releases; it can be self-hosted or used as a hosted service.
mcpspan Features:
Call Analytics: Track tool calls, resource reads and prompt requests by client, including which tools agents see but never call.
Timing and Answer Size: Review median and 95th-percentile response times, full timing distributions, and typical, large and largest answers for each tool.
Failure Analysis: Separate refused arguments, handler crashes and tool errors, and inspect missing tool requests alongside the closest available name.
Session Tracing: Follow calls in the order an agent made them, see repeated calls with the same arguments, and inspect what followed a failure.
Release Comparisons: Compare server versions over matching time periods, with changes in errors, response times and failure types highlighted.
Flexible Setup: Instrument servers with SDKs for eight languages or use a proxy for MCP servers over stdio or HTTP, without changing server code.
Tool Definition Linter: Run mcpspan-lint before shipping to find tool definitions that may confuse agents or cause clients to refuse a tool.
mcpspan Benefits:
Find Root Causes: Distinguishing failure types and showing which arguments did not match helps teams focus fixes on the part of a call that went wrong.
Catch Regressions: Release comparisons make it easier to spot when a change affects specific tools, before a broad server health check reveals the problem.
Improve Agent Fit: Seeing unused tools, guessed names and repeated calls can help teams refine tool names, descriptions and schemas around real agent behavior.
Protect Sensitive Data: Parameter values stay in the server process, giving teams a way to inspect usage without sending those values to the analytics installation.
Choose Your Hosting: Self-hosting keeps the installation and data under your control, while the hosted option avoids maintaining a server for the dashboard.
Use Cases:
Debug Failed Calls: When agents report that a tool did not work, inspect whether arguments were refused, a handler crashed or the tool returned an error.
Review a Release: After shipping a new MCP server version, compare its errors and response times with the previous version over an equivalent period.
Refine Tool Definitions: Before publishing a server, lint tool definitions and use observed name guesses or unused tools to identify confusing descriptions.
Investigate Agent Loops: When an agent seems stuck, trace its session to find repeated calls, the preceding call and what it did after each failure.
Monitor Server Usage: For a team running MCP servers for multiple clients, track call patterns and set alerts for rising errors or a server going quiet.