

What is Napkin?
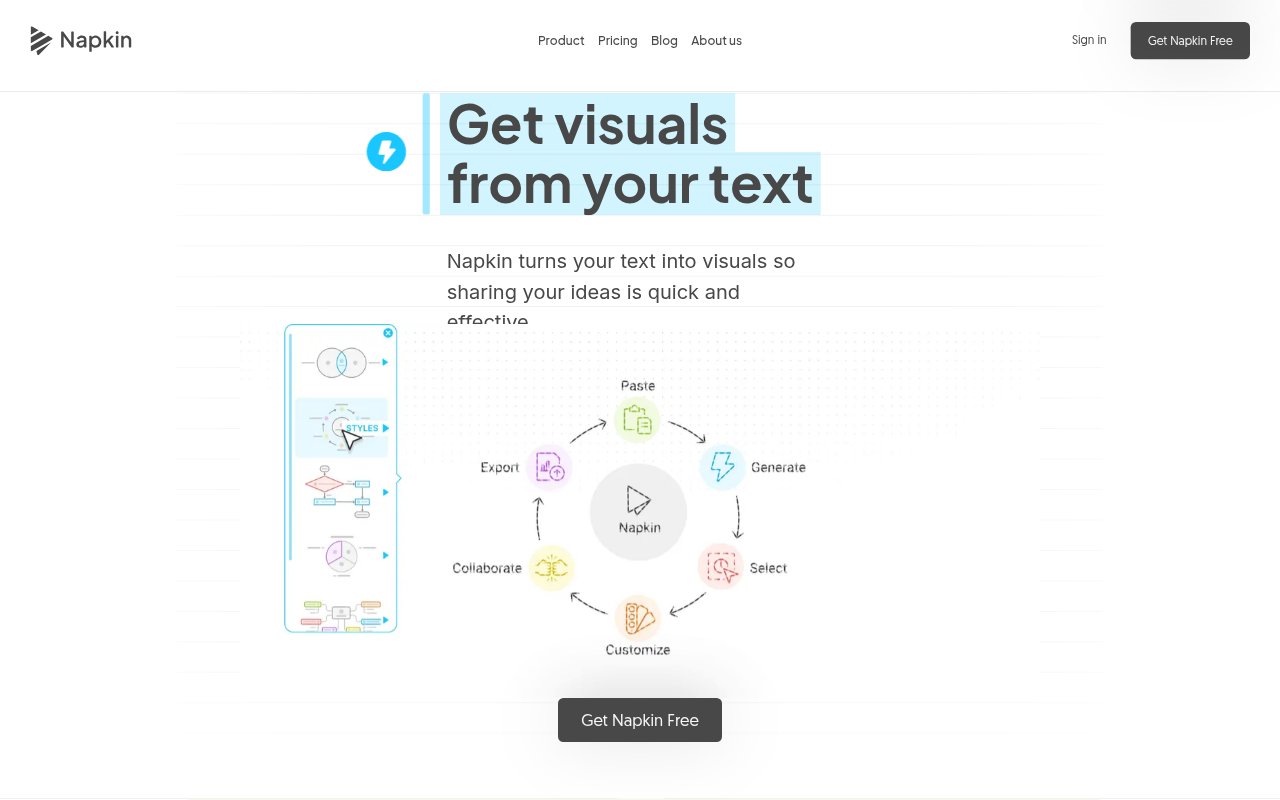
Napkin turns written ideas and existing documents into diagrams, infographics, mind maps, flowcharts, data charts, and presentation slides. It is for people who need to explain information visually, including founders, marketers, educators, and business teams. Users can generate visuals from their content, choose a result, then edit its elements and export it for use in other materials. Teamspaces support shared editing and feedback.
Napkin Features:
Text Import: Users can write, paste, or import content in PPT, DOC, PDF, HTML, and MD formats to start creating visuals.
Visual Generation: Napkin analyzes selected text and suggests visuals such as infographics, diagrams, flowcharts, mind maps, and data charts.
Slide Creation: Napkin Slides turns ideas into presentation-ready decks and works with users before building the presentation.
Visual Editing: Users can change colors, fonts, layouts, and icons, reshape individual elements, or replace a visual.
Brand Styling: Brand Studio supports brand colors and fonts, while paid plans include brand styles and custom branding options.
File Export: Visuals can be exported as PNG or PDF, with PPT and SVG export available on paid plans.
Team Feedback: Teamspaces let members edit together in real time and use comments and highlights to give feedback.
Napkin Benefits:
Faster Drafting: Generating a starting visual from existing text reduces the effort of building diagrams and graphics from a blank page.
Clearer Explanations: Turning written ideas into visual formats gives audiences another way to follow processes, data, and relationships.
Greater Control: Editable elements let users refine a generated result to fit the message instead of settling for a fixed design.
Consistent Materials: Brand styling helps keep visuals aligned with a company's colors and fonts across presentations and other content.
Reusable Outputs: Multiple export formats make it easier to carry visuals into documents, slide decks, reports, and social posts.
Shared Review: Real-time editing and in-context feedback help teams discuss and revise visuals in one shared workspace.
Use Cases:
Presentation Slides: Turn a written project update or business idea into a diagram or visual to include in a presentation.
Process Documentation: Map a complicated workflow as a flowchart that colleagues can consult while reading internal documentation.
Social Posts: Create an infographic or diagram from an article's key points for a LinkedIn post or other social content.
Teaching Materials: Convert lesson notes into mind maps, charts, or diagrams that help explain a topic to students.
Data Reporting: Turn data or text into an editable chart for a report, presentation, or business review.
Team Reviews: Share a draft visual in a Teamspace so colleagues can edit it together and leave comments or highlights.