
What is pw-repl?
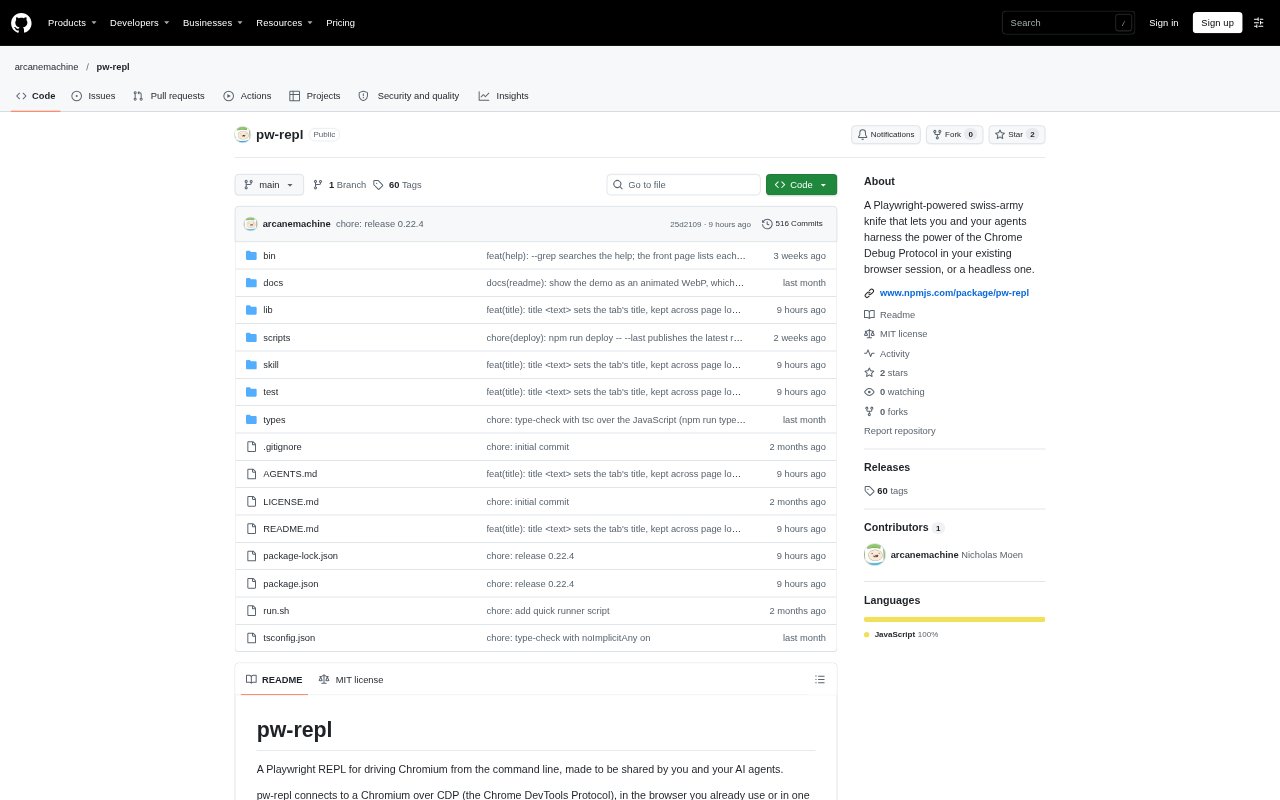
pw-repl is a command-line tool for controlling Chromium through Playwright commands, either in a browser you already use or one it starts. People can inspect and interact with pages from a terminal, while AI agents can send commands to the same REPL. It is aimed at developers and teams testing web pages, investigating browser behavior, and sharing browser work between people and agents.
pw-repl Features:
Page Inspection: Read accessibility snapshots with clickable references, page text, HTML, attributes, links, form controls, event listeners, and screenshots.
Browser Controls: Use commands to click, type, fill fields, select options, upload files, scroll, drag, answer dialogs, and manage tabs and windows.
Network Inspection: Review recorded requests and responses, response bodies, WebSocket and SSE messages, console output, and page errors.
Response Simulation: Fake, patch, delay, redirect, or fail network responses, and control WebSocket traffic to test how a page handles changes.
Browser Emulation: Emulate mobile settings, viewport sizes, dark mode, reduced motion, forced colors, print styles, locale, and timezone.
Session Recording: Record browser actions, request timelines, console and socket activity, or videos with captions, a pointer, and highlights.
pw-repl Benefits:
Shared Visibility: People can follow an agent's browser actions in the REPL, making it easier to understand what changed during a session.
Keep Browser State: Working in an existing browser preserves its tabs, logins, and state instead of requiring a fresh profile.
Repeatable Investigations: Saved recordings of manual steps can be run again, helping teams compare behavior or hand a reproducible flow to an agent.
Isolated Experiments: Applying network and display changes to one tab lets you test edge conditions without disturbing other open tabs.
Clearer Bug Reports: Recorded steps, network activity, and annotated video give collaborators concrete evidence when explaining a browser issue.
Use Cases:
Reproduce UI Bugs: A developer can reproduce a reported issue by clicking through a page while an agent observes the recorded steps and resulting requests.
Test API Failures: A QA engineer can simulate failed, delayed, or modified API responses and check how the interface responds.
Check Mobile Layouts: A web team can inspect a page under mobile emulation, different viewport sizes, dark mode, or reduced-motion settings.
Investigate Slow Pages: A developer can profile main-thread activity, long tasks, layout work, frame drops, and time from input to the next paint.
Document User Flows: A product or support team can record a browser walkthrough with captions and highlights to explain a workflow to colleagues.