

What is RowSpeak?
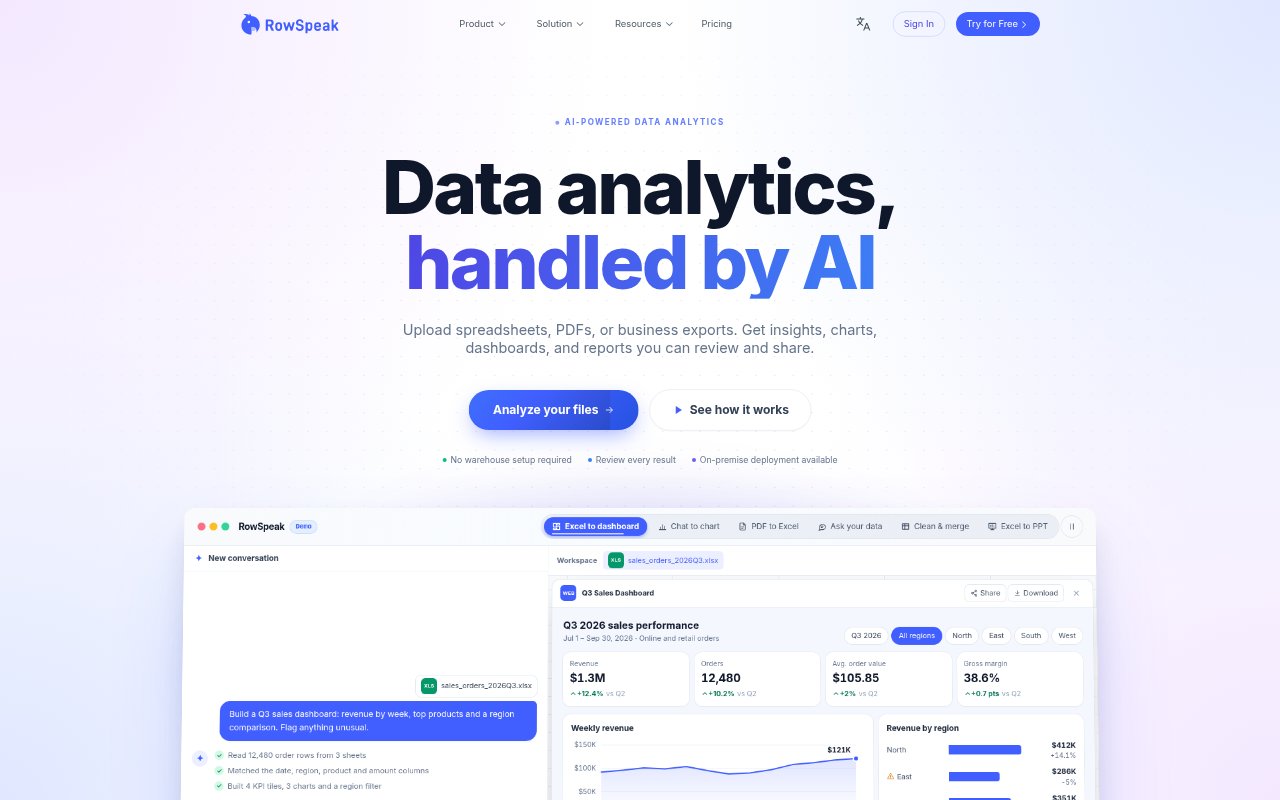
RowSpeak is an AI tool for working with Excel and CSV files, PDFs, and tables in images. It lets business teams ask questions about data in plain language, make spreadsheet changes, and produce analysis, charts, dashboards, and reports. Finance, marketing, sales, and operations teams can use it for routine spreadsheet work or to explore business data. Organizations can also deploy it on-premise or in an air-gapped environment.
RowSpeak Features:
Spreadsheet Assistant: Ask for spreadsheet operations in natural language, including writing formulas, combining data, and making changes that can be reviewed.
Data Analysis: Ask questions about Excel or CSV data to find trends, outliers, changes, and other analytical insights.
Data Cleansing: Request fixes for duplicate records, inconsistent formats, and blank cells using plain-language instructions.
PDF and Image Import: Convert tables from PDFs and images into editable Excel data for further analysis.
Charts and Dashboards: Create graphs from spreadsheet data or turn an Excel spreadsheet into an interactive dashboard.
Reports and Templates: Generate reports or spreadsheet templates by describing what you need in natural language.
Private Deployment: Run RowSpeak on-premise or in a fully air-gapped environment with Docker and open models such as DeepSeek or GLM.
RowSpeak Benefits:
Less Manual Work: Plain-language requests can reduce the need to handle common formula, cleanup, and data-combination tasks cell by cell.
Faster Data Review: Summaries, trends, and outliers help teams focus their attention on findings that may need investigation.
Clearer Reporting: Charts, dashboards, and written reports make spreadsheet results easier to review and share with colleagues.
Reusable Data: Converting tables from PDFs and images into editable spreadsheets makes those records easier to analyze alongside other data.
More Data Control: Private deployment gives organizations an option to keep spreadsheet processing inside their own network.
Use Cases:
Budget Variance Review: Compare actual spending with budget figures and review variances or forecast accuracy.
Management Reporting: Turn business spreadsheets into executive-level reports with supporting charts and key findings.
Revenue Forecasting: Review revenue trends in sales data to support forecasting and understand changes over time.
Inventory Monitoring: Analyze supply and inventory spreadsheets to understand stock status, movement, and changes.
Marketing Analysis: Explore campaign or growth data in spreadsheets and create charts or reports for marketing teams.