

What is Text2Infographic?
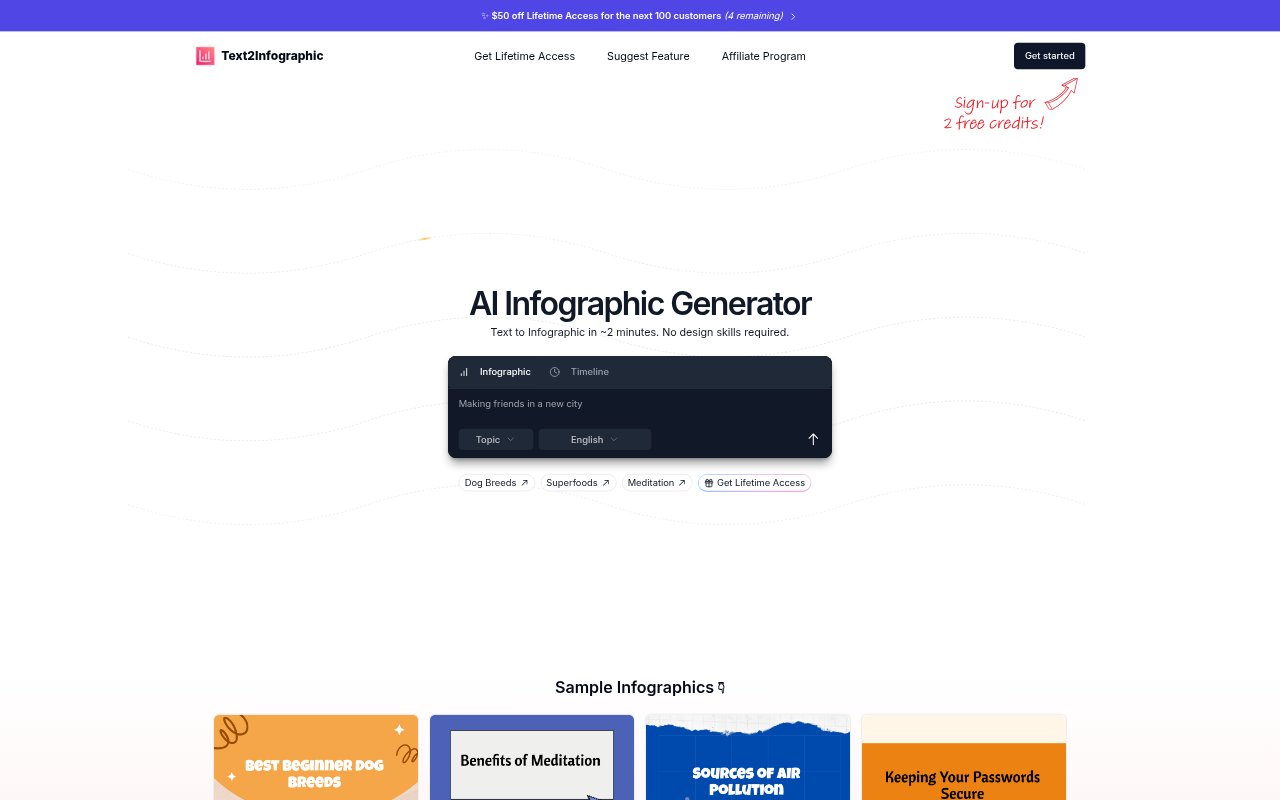
Text2Infographic turns written content, web pages, and uploaded files into infographic designs using AI. It is aimed at people who need visual content for blogs, social media, presentations, or reports, including content marketers and social media managers. Users can start with a text description or existing material, review generated designs, and adjust the result in an editor without needing design skills.
Text2Infographic Features:
Text And File Input: Create an infographic from a text description, a URL, or an uploaded file, including Word documents and Google Docs.
Blog Conversion: Paste a blog post URL to generate several infographic designs based on its content, then preview and edit them.
Spreadsheet Conversion: Upload Excel or Google Sheets data to produce infographic designs that turn spreadsheet information into visual content.
AI Topic Research: Generate infographic content with AI topic research and summarization, rather than beginning with a finished piece of writing.
Design Customization: Edit generated infographics by changing colors, fonts, images, logos, and content to suit a particular style or brand.
Citations And Languages: The tool can add citations automatically and supports creating infographics in more than 20 languages.
Text2Infographic Benefits:
Faster Visual Production: A generated starting point can reduce the time spent researching, planning a layout, assembling visuals, and making final adjustments.
Lower Design Overhead: People without design experience can produce infographic drafts without installing design software or learning a specialist tool.
More Content Mileage: Turning existing articles and data into visuals gives teams another way to present material they have already created.
Consistent Brand Output: Editable colors, fonts, and logos help users bring generated visuals closer to their existing brand presentation.
Broader Audience Reach: Multilingual infographic creation gives teams a way to adapt visual explanations for audiences in different languages.
Use Cases:
Blog Social Posts: Repurpose a published blog post into visual pieces for social media, using its URL as the starting point.
Report Visuals: Turn spreadsheet data into an infographic to include in a business report or share as a standalone visual.
Presentation Material: Create a visual summary from document content or spreadsheet figures for use in a presentation.
Topic Explainers: Start with a subject such as meditation or air pollution and generate an infographic from a short description.
Localized Content: Prepare infographic versions in different supported languages when communicating information to multilingual audiences.